Maps and TX11
This page explains how we used maps and data to determine which voters live in the gerrymandered congressional district TX-11. We’ll walk through the process from high-level maps to visualizing voter registration and turnout data for further action.
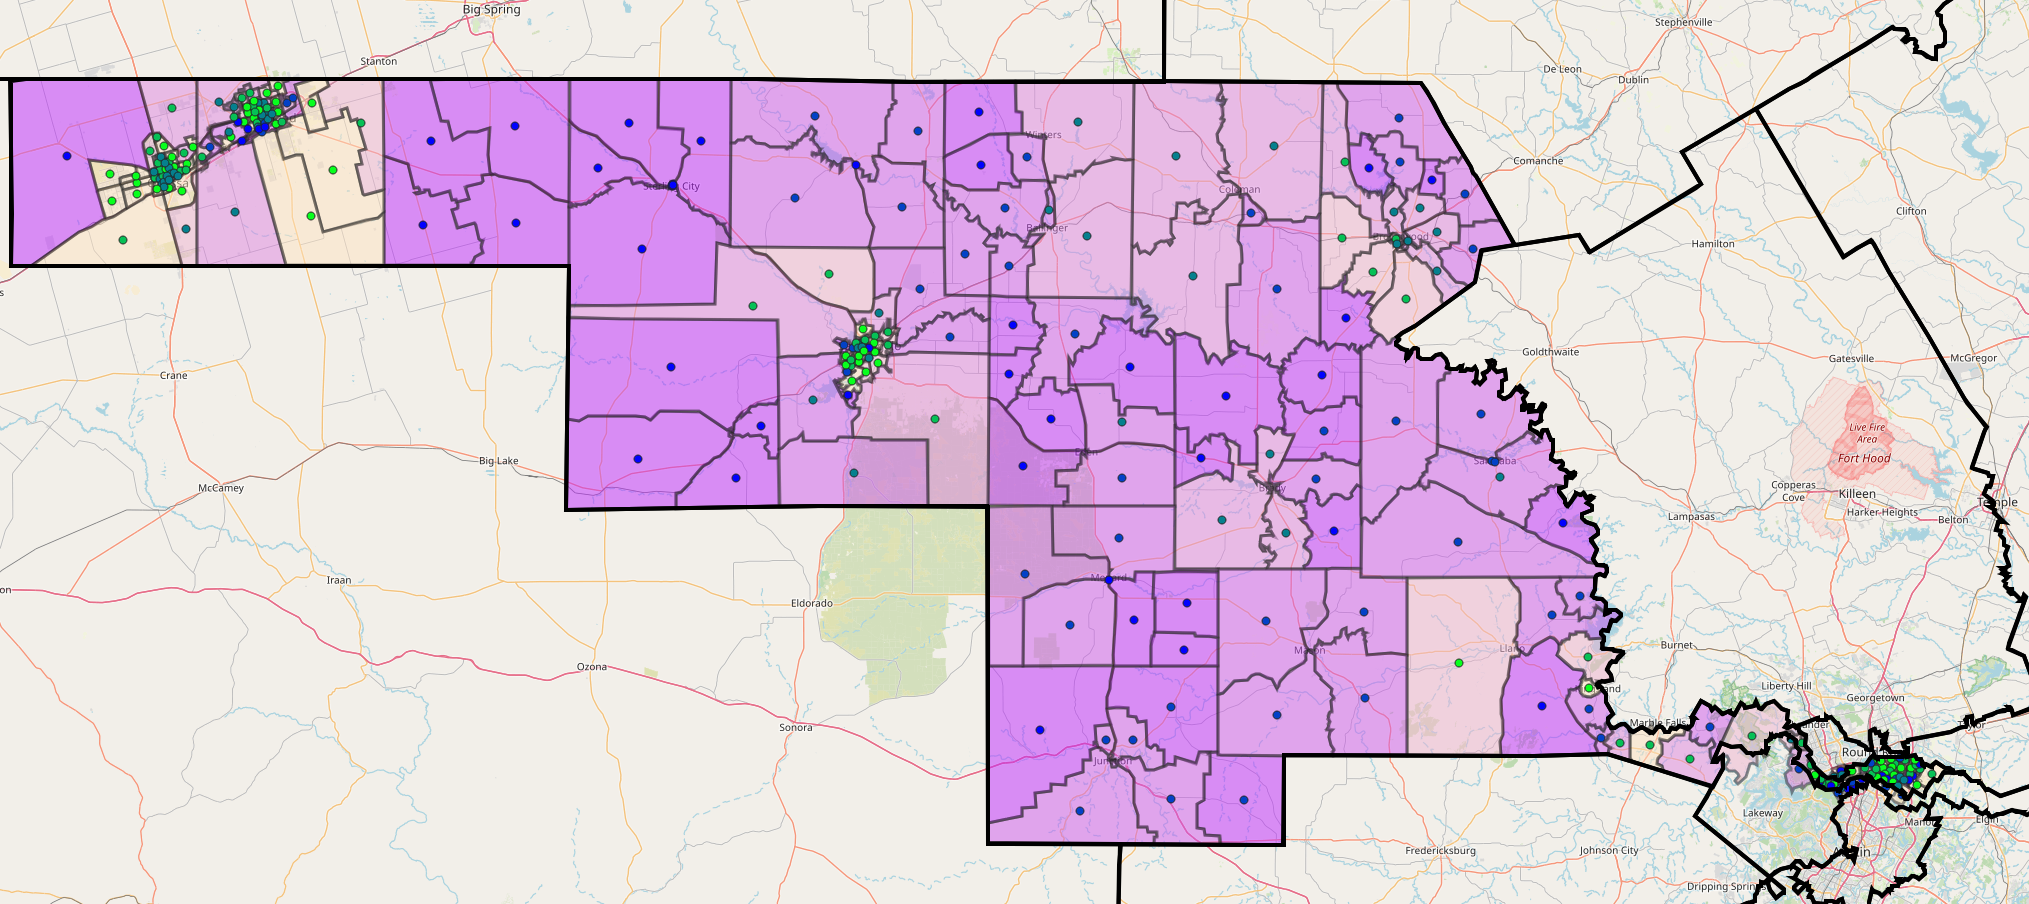 TX-11 Precincts: A Green dot means at least 3000 Voting Age People, Purple means higher Turnout %
Due to the heavily gerrymandered maps, you cannot use typical processes such as county lines as the boundary. The congressional districts seem to readily cut and carve through any jurisdiction with little regard for communities.
In order to know which congressional district someone is in, we have to take their registered address and turn that into a set of latitude/longitude coordinates. After doing that, we can then check if that address exists within the boundaries of TX-11.
I had hoped to provide complete set of maps for TX-11, including Odessa and Midland. However, every county I’ve reached out to has had issues being able to provide the needed databases. When pressed for an answer, county election officials have said that it is due to the Texas Secretary of State(SoS) not releasing the databases to them.
Important Notes
When reviewing that data, some odd things may pop up and it’s important to remember a few things.
- The redistricting was done with 2020 Census population counts.
- The Austin metro area has grown signifcantly in the last few years.
- With these two facts, you can have numerous instances where the registered voter count is higher than the reported population, depending on the source used.
- All data used here is publicly available and not used in any commercial sense.
Key terms:
- Census block: The smallest unit of census data, often covering a few homes or a single street and providing statistics like income, age and race and population.
- VTD (Voting Tabulation District): A precinct where voters cast ballots.
- Geocoding: Converting an address (e.g., “123 Main St”) into map coordinates.
- GIS (Geographic information system): A software that draws maps and provides tools to give goegrpahicaly-aware context from different data sets.
Tools used:
- OpenStreetMap (OSM): : A user-generated map of the world, where anyone can contribute information about streets, buildings, and points of interest.
- Nominatim: A search engine that helps find specific locations on OpenStreetMap.
- QGIS: A free and open-source geographic information system (GIS) for viewing, editing, and analyzing geospatial data.
- PostGIS: An extension of PostgreSQL that helps store and manage large amounts of spatial data.
Data Sources
The Texas State House took gerrymandered maps provided by law firm Butler Snow. These maps, using a variety of public and private data sources, slice Texas up at the census block level into new congressional districts. The sources includes US Census and voter turnout as well as private data collected by the National Republican Redistricting Trust.
For an example of how small a Census block can be, you can see an example here:
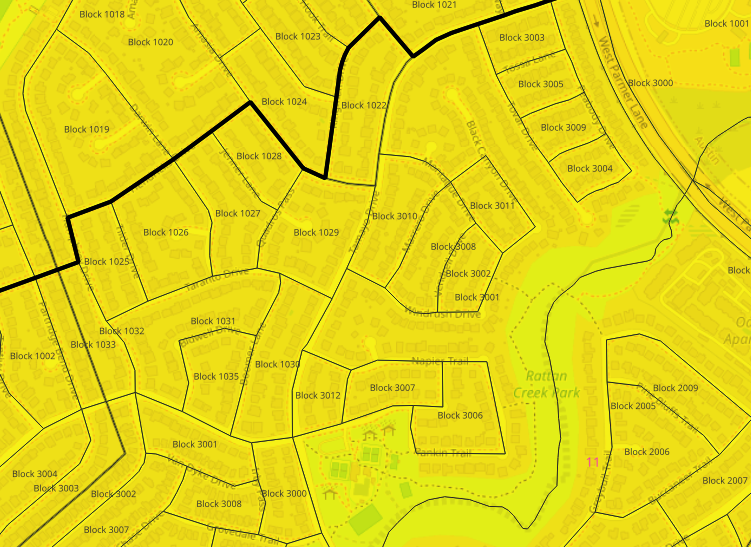 The big black line is TX-11’s boundary. You can see how it follows Census Blocks
You can also take a look at data for a sample block here
In assembling the data and maps for determining who exactly is in TX-11, we had a couple of different sources to look at:
- The redistricting maps known as PLAN C2333 provided by the Texas House.
- Voter Tabulation District(VTD or better known as Precincts)
- County voting data(just Travis for now)
- Nominatim from OpenStreet Maps for Geocoding locally
These source include shapfiles and csv files that joined together to provide a full picture.
For example, in the PLAN C2333 files, we have a variety of census datasets around the VTD as well as the shapes of each congressional district. The data is not in easy to parse CSV format but is relatively straightforward to process.
The VTD information files, acquired from the SoS, provides the shape of each precinct in each county. With registered voter data from the county data, we can then figure out the composition of active voters(for example, those active and voting in the last several elections) and get a better sense of the voter turnout.
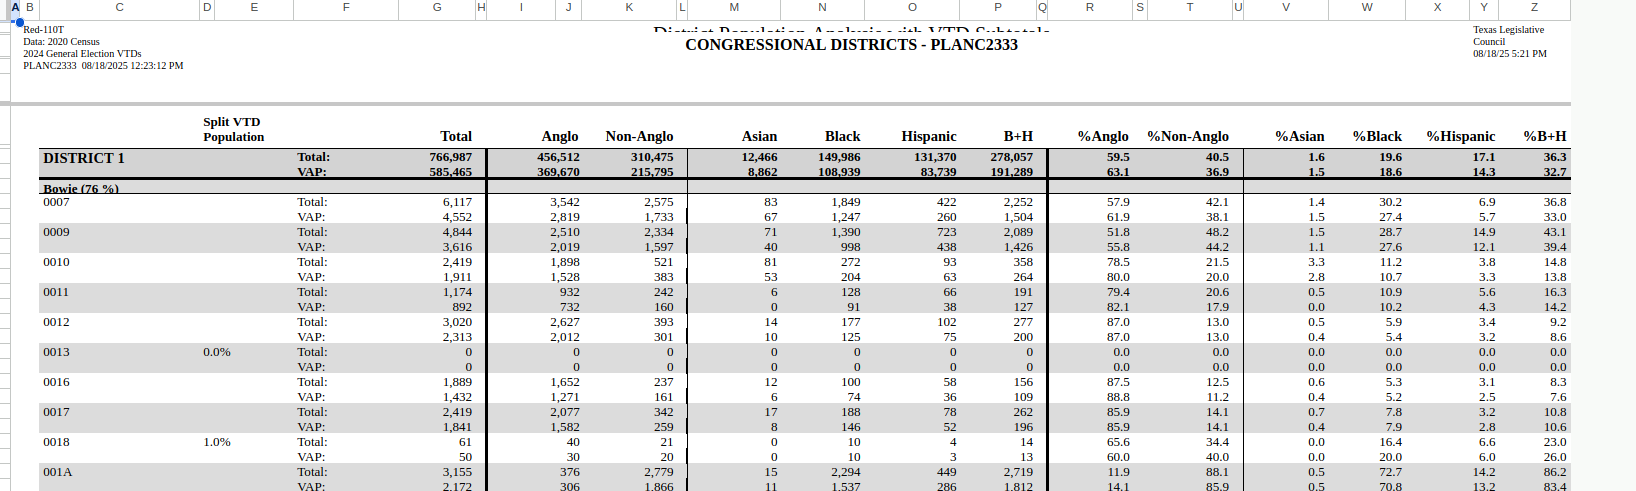 Example of VTD Census data used in PLANC2333
Finally, with geocoding provided by a local Nominatim instance, we can have a map marker for each voter. This allows us to get a very real sense of how where voters live.
Challenges in reviewing the data
The challenges faced with integrating the data are this:
- PLANC2333 census data isn’t in csv files - the data itself is of limited value but represents another manual step in preparing things.
- The redistricting data uses either all or parts of a VTD. This means we cannot solely use VTD boundaries or county data.
- The voting and turnout data isn’t 100% aligned with census block data so geocoding (turning an address into a latitude/longitude for map plotting) is all but required to have an accurate depiction of voters in TX-11.
- Congressional districts must be contiguous (connected), which sometimes creates oddly shaped boundaries (fun fact: this is the origin of the term “gerrymander,” as they seem to resemble mythical “salamanders”).
It’s important to note that this complex process is, in this case, exclusive to the Austin area. In other, sparser-populated parts of TX-11, boundaries are more straightforward and follow established county lines. Thankfully, with several tools, we can easily aggregate the data into databases and a GIS.
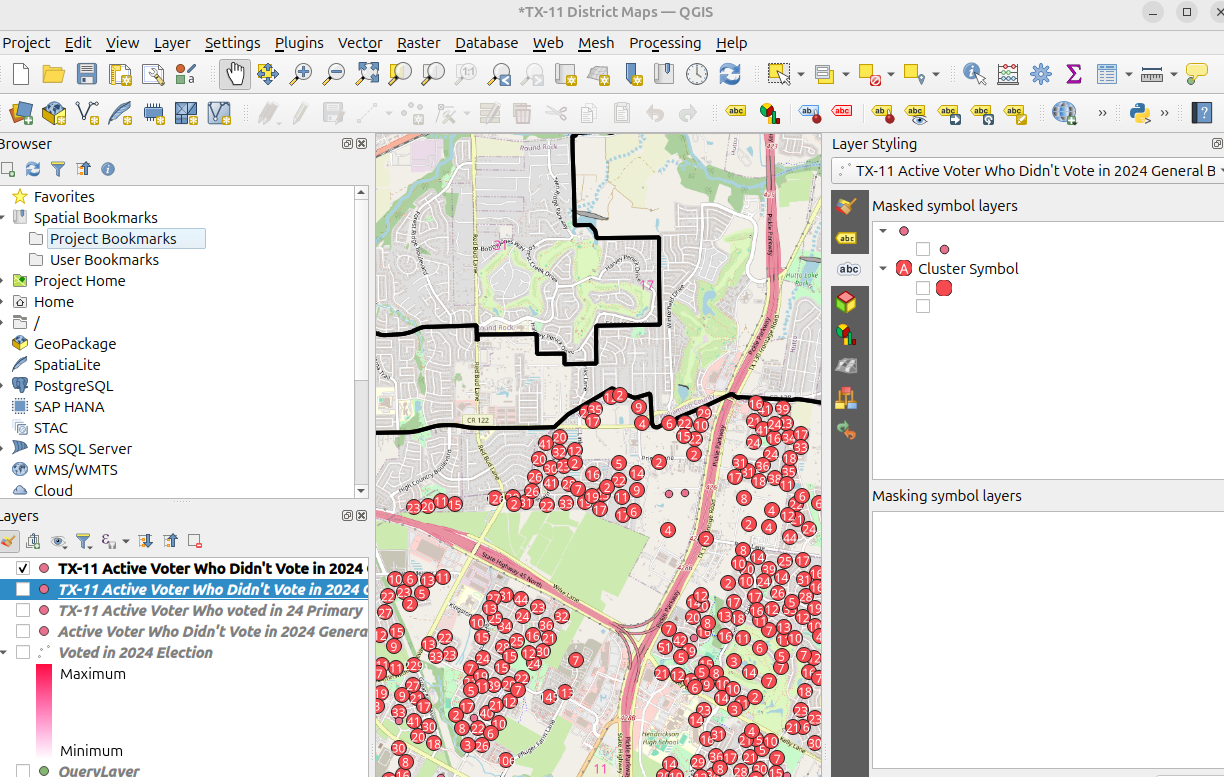 QGIS makes aggregating and visualizing the various data sources much easier.
One key thing is that the various datasets do use consistent precinct/VTD codes.
Visualizing Voter Turnout
Once the data is acquired and geocoded, you get a sense of the population and voters turnout of TX-11. For example, it’s clear that both that the Austin area and, specifically, Pflugerville is one of the key areas in TX-11.
In the 2024 general election, of all of the ballots cast in the new TX-11 boundaries, Pflugerville represents the largest by far slice of election turnout:
| City | Vote Count |
|---|---|
| Pflugerville | 36767 |
| Austin | 17425 |
| Cedar Park | 4890 |
| Coupland | 56 |
| Hutto | 223 |
| Jonestown | 6 |
| Lago Vista | 56 |
| Leander | 4691 |
| Liberty Hill | 17 |
| Manor | 106 |
| Marble Falls | 39 |
| Round Rock | 2826 |
| Contrasting this to the 2024 Old TX-11 Election Turnout of 211k votes, the Austin area would now comprise 29% of the turnout |
As a result of analyzing the data in our GIS system, we can start to see more insights like primary turnout & voters who may have abstained from voting in 2024 and more.
We can see in this example a low turnout VTD(~1.5k registered didn’t vote)
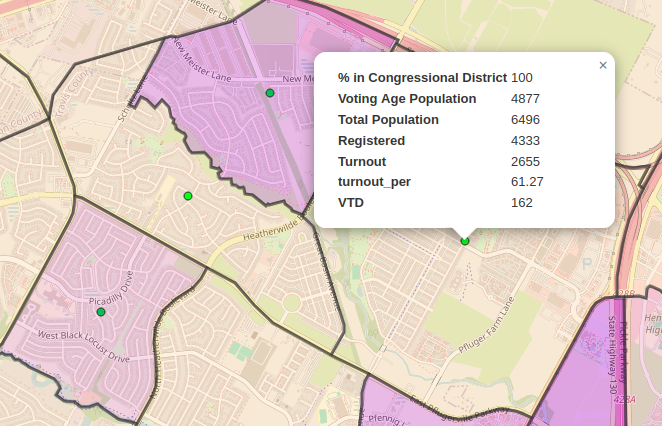 A high level view of one VTD including 2020 Census data and Registered/2024 Turnout Amounts
And then the clustered addresses where registered voters didn’t vote in 2024.
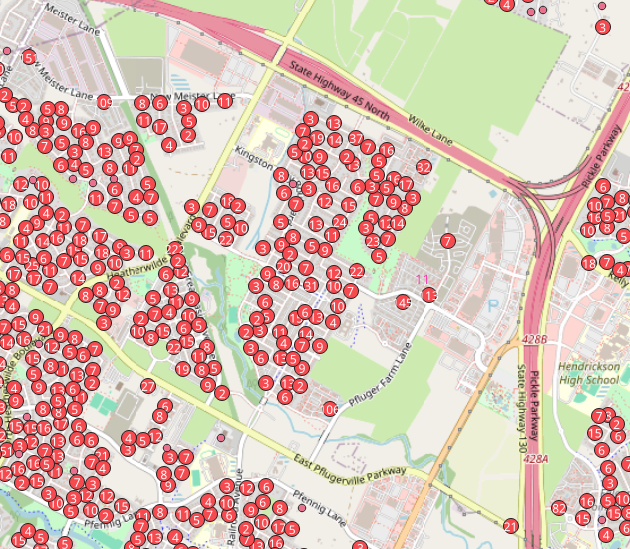 Geocoded Addresses allow us to visualize the very street-by-street turnout
You can also compare with previous election turn outs and, with some SQL, visualize the differences of 2022. Here, we have a map of clustered voters who voted in 2022 but didn’t vote in 2024.
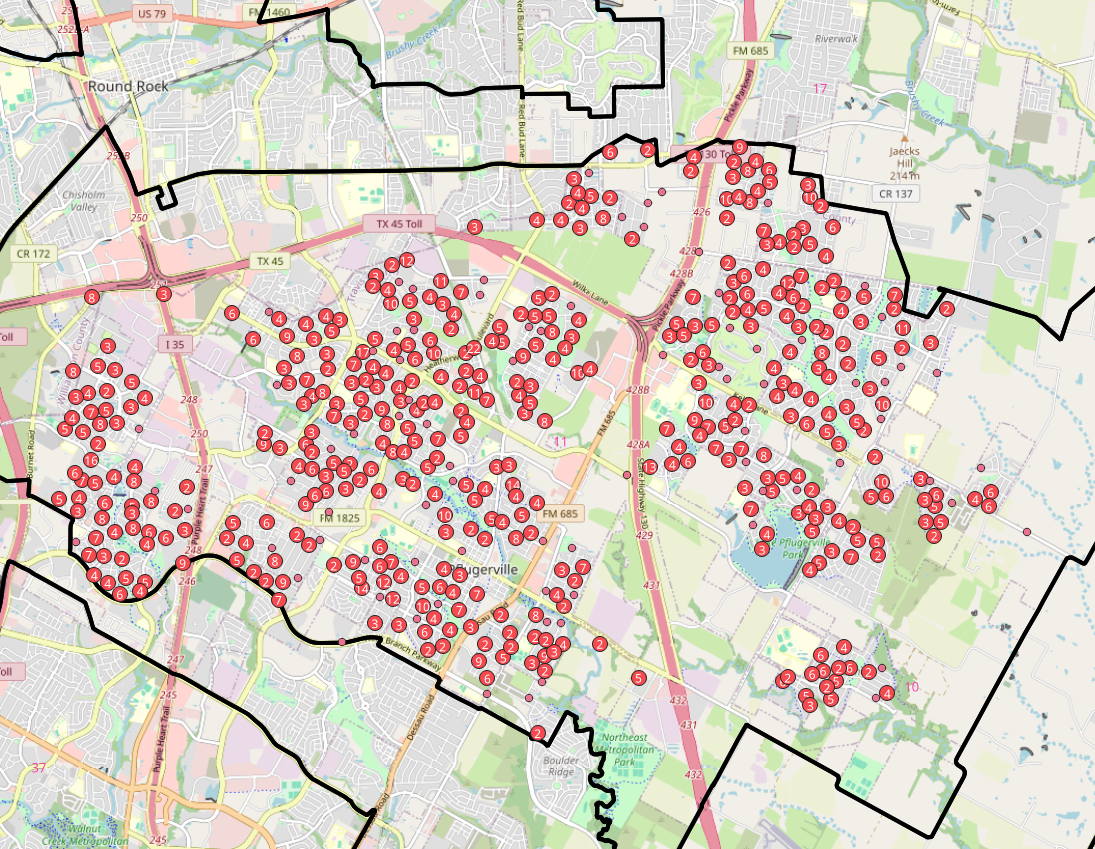 This picture shows 2022 voters who didn’t vote in 2024.
Next Steps
Efforts are ongoing to acquire data from other counties in TX-11. Until then, Travis County data provides a starting point for understanding voter trends and opportunities for outreach. Our goal is to use this geographic data so we know where we can focus our efforts and make the biggest impacts.